The Hertzsprung-Russell Diagram
Bert Stevens
One of the most significant discoveries was that by Ejnar Hertzsprung and H. N. Russell. These two astronomers, each acting independently, observed each star in the Pleiades with a photometer. This device provides an electical current proportional to the amount of light coming from the star. This current is measured and the brightness of the star, in magnitudes, computed.
Hertzsprung and Russell had each chosen the Pleiades for study because as an open cluster, all the stars in the Pleiades are of the same distance, since they were all formed out of the same gas cloud a mere 4.2 million years ago. This meant that the brightness differences between the stars of the Pleiades must be caused by an intrinsic property of each star rather than by the stars being at different distances.
This "discovery" was not particulaly new, but a confirmation that different stars had different intrinsic brightnesses. Hertzsprung and Russell felt that if the brightness of a star was a property of that star, then there may be some other properties of the starlight that would shed light on the nature of stars.
Light is the only property of a star that can be measured directly, so Hertzsprung and Russell went back to the telescope and re-measured the brightnesses of the different stars. This time they took two measurements of each star. The first was through a filter that allowed only blue light to reach the photometer. This measurement was called the B(lue) magnitude of the star. The second measurement was through a yellow filter that closely matches the spectral response of the eye. This measurement was called the V(isual) magnitude of the star. Comparing these two magnitudes, we can measure the color of the star.
The difference between the B-magnitude and the V-magnitude is called the color index of the star and indicates it's color. If the star was really "white", then the star would have the same brightness in the blue part of the spectrum (B-magnitude) as in the visual (yellow or V-magnitude). The difference of the B-magnitude minus the V-magnitude, written B-V, would be zero. Note that this difference is a constant regardless of the magnitude of the star or it's distance. What can affect the color index is interstellar dust, which causes a "reddening" of the star.
If the star is bluish, then the B-magnitude will be brighter, meaning it will be numerically smaller (remember that first magnitude stars are brighter than second magnitude stars). This makes the difference B-V negative for bluish stars. The more negative B-V, the bluer the star. Reddish stars have smaller V-magnitudes, making the difference B-V positive. The more positive B-V, the redder the star.
Our sun has a color index of +0.63, making it somehat yellowish. Betelgeuse, in Orion, has a color index of +1.87, indicating a very red star: a red giant. Achernar (Alpha Eridani) is a blue giant, and has a color index of -0.16. Vega with a color index of 0.00 is a white star.
Hertzsprung and Russell completed their color index measurements on the Pleiades and then plotted the magnitude of each star on the y-axis and it's color index on the x-axis. The resulting diagram showed an amazing correlation between the color index and the magnitude!
This diagram reproduced here is called a Hertzsprung-Russell diagram (or H-R diagram for short). It shows that most of the stars can exist only with certain color indices and brightnesses. The main line of stars from the upper left to the lower right is called the main sequence (this chart shows primarily the main sequence). The stars in it are called main sequence stars.
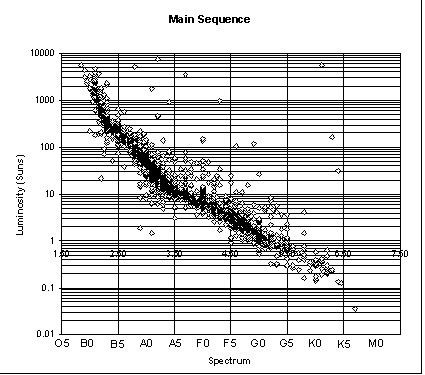
The stars (not shown here) that are not on the main sequence are either dwarf stars (lower left) or giant stars (upper right) that are either near the beginning or the end of their life cycle.
Magnitude and color measurements of nearby stars whose distance is known from trignometric parallax allow the H-R diagram to be calibrated in absolute magnitude. Absolute magnitude is the brightness of a star as it would be measured from a distance of ten parsecs from the star.
The H-R diagram can then tell us the actual brightness of a star based on it's color index and the knowledge that it is a main sequence star. This was a tremendous step forward in understanding the nature of stars. It led to an understanding of the evolution of stars from dwarf to main sequence to giant and then back to dwarf.
The truly amazing thing about the H-R diagram is the large variety of labels that can be put on the axes of the H-R diagram. For example, the same diagram that plots magnitude vs color index also plots absolute magnitude vs surface temperature, and absolute magnitude vs spectral classification. This lead to relating color index, spectral classification, and stellar temperature. Thus, Hertzsprung and Russell discovered a starting point for the science of Cosmology and stellar evolution, on which all astrophysics has been built.
Published in the August 1996 issue of the NightTimes


