The Digital Sky
Jack Kramer
There's an affinity between computers and astronomy. Astronomers, both amateur and professional, have made wide use of the Internet, and the power of the computer is indispensable for CCD work and the heavy number crunching of astrophysics. Beyond that, amateur astronomers just tend to be tinkerers. Since we generally feel at home with "gee whiz" technology, many of us are computer buffs. This may extend from the sophistication of CCD work to the simple pleasure of ogling those Hubble Space Telescope images on our monitors. One of the bits of software that's been around since the days of the trusty old Commodore computer is the planetarium program. These programs, which show an on-screen version of the night sky, exhibit various amounts of complexity and accuracy. In past years, they were useful only to see what constellations were up at a certain time on a certain night. The better ones also showed the moon and planets and a number of deep sky objects. But to really find anything faint, you've always really needed a good sky atlas.
Well, things have changed somewhat. The sophistication of a few planetarium programs has increased to the point where they show an amazing amount of detail. However, I still find it more convenient to use a good hard-copy atlas such as the Uranometria or Sky Atlas 2000, especially in the field. One limitation of the on-screen version is the small slice of sky encompassed in the image. As you zoom into an area that's crowded with deep sky objects, your on-screen window is so small that star-hopping or object-hopping is often quite awkward. Printing the image doesn't get you anything beyond what's on-screen. This is a major drawback of the Home Planet freeware program that we have in our club library.
But now comes a program called Guide - Project Pluto. It's just one example of the very detailed programs now available, but it's an especially good example of a way to put the power of the computer to work. Among other features, you can enter orbital data for comets so as to track them across the sky. Unlike earlier programs, this one assumes that observers already know which constellations are in the sky when they want to observe, so it isn't concerned about presenting a large-scale view. Instead, it concentrates on providing an abundance of deep sky objects to whet the appetite of any deep sky observer with a medium to large telescope. It also shows the field in a large, easy-to-read window. This much data mandates that the program be available only in the form of a CD-ROM. The chart image in the adjoining column is from Version 4. A newer version released last year has made the interface more user-friendly, added objects to the database, and made it easier to add data for newly-discovered comets.
The example shows the area around the galaxy NGC 3972, which is in Ursa Major just north of the star g (64 Ursae Majoris, known as Phecda). There are many options. In this case, the limiting magnitude was set at 14.0. The "zoom" was set so that the size of the field would be about one-half degree across. The Tirion Sky Atlas 2000 shows only NGC 3972. The Uranometria also shows NGC 3977 and 3990, but not the galaxies UGC 6919 and PGC 37555. (UGC stands for "Upsala General Catalog" and PGC stands for the "Principal Galaxy Catalog", which lists over 73,000 galaxies.) If you wanted to look for the fainter galaxies in this area, you could print off a copy of this chart to take along when you observe. Guide also shows clusters of galaxies as large circles to indicate the location of the clusters, but not the individual galaxies within the clusters. Even this is a step in the right direction, because galaxy clusters are sadly lacking on almost all widely-available start atlases.
But as they used to say, "You ain't seen nothin' yet!" The next step is the Palomar Observatory Sky Survey, which is more realistic than the planetarium programs simply because the objects shown are the actual images of the objects. While the POSS is available for purchase on a set of nine CD-ROMs, it's also accessible via the Internet at:
http://stdatu.stsci.edu/cgi-bin/dss-form
These Digitized Sky Surveys were produced at the Space Telescope Science Institute from photographic data obtained using the Oschin Schmidt Telescope on Mount Palomar and the UK Schmidt Telescope for the sky in the southern hemisphere. Both versions of the Palomar Observatory Sky Survey atlas (POSS-I and POSS-II) were made by the California Institute of Technology with grants from the National Geographic Society and other interested groups.
When you access the POSS web page you'll be presented with a variety of options, among which is specifying the area of the sky where you want to look. You can center the field on a particular deep-sky object, or provide center-of-field coordinates. For the image on the following page, I used coordinates, which were entered as "11h 56m" and "+55.5" (don't include the quotation marks). Another option is the format for the image. The options are FITS and GIF; normally select GIF, since virtually all web browsers can display this format. In addition, we have GIF image viewing software available in the LCAS library, so you can save the image and view it while off-line. The default field size is only 15x15 arc minutes, which means you're taking in a pretty small slice of sky. But you can opt for a field size up to a maximum of 60x60 arc minutes (one degree). I recommend at least 30x30, which is the size of field in the sample image shown below. Be aware that you'll be spending a lot of time on-line if you select 60x60 because it takes a long time to download such a large, detailed image. If you choose to save the image to your PC, that adds even more time. If you're sure of the field you want, you can forego looking at the image on-screen and simply save it directly to disk. The image here has been shrunk to fit conveniently in this column, but on your monitor the image fills the entire screen; in fact, you have to scroll across and down to view the entire field. The coordinates I selected placed the center of field approximately at the same point as in the Guide chart on the previous page.
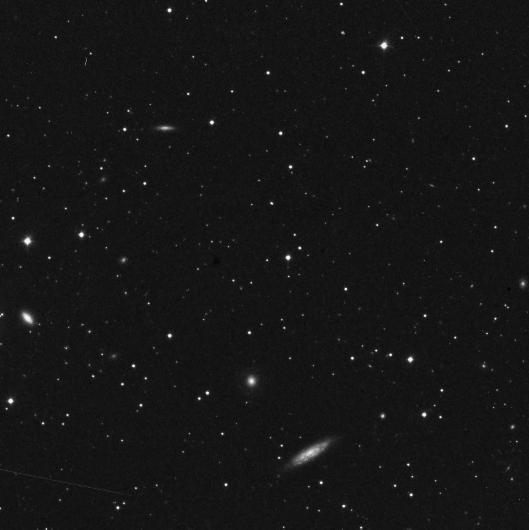
It's especially helpful to see how the deep sky objects actually appear. Another advantage is having more stars available for star-hopping than could ever be included in an atlas, plus seeing them at their true brightness level. Of course, the disadvantage of the POSS is that there are no designations to tell you which object is which.
With all these computer resources available, which should you use? Both of these will help you plan a search in a particular area and verify your previous observations. And from both sources you can take with you printed copies of the fields where you intend to observe. But a lot of observing ends up being somewhat unplanned. As a purely practical matter, you can't always have a PC available in the field, and it's even less likely that you'll have a phone line when you're out observing and want to look at the POSS web page. So you probably need one more thing, as well: a detailed star atlas...the old fashioned kind...printed on paper.
Published in the February 1997 issue of the NightTimes


